Integrate with Grafana
Connect Exoscale Managed Grafana (or external Grafana) to query metrics from Thanos.
Create your Data Source
Connect to your Grafana Dashboard.
Note
If you have an issue accessing it, verify on the Exoscale Console in your DBaaS Grafana Config that you have an IP filter set (like 0.0.0.0/0 if you want it open to all IPs).
In the Menu, go to Connections > Data sources

Add new data source (on the top right)
Choose Prometheus

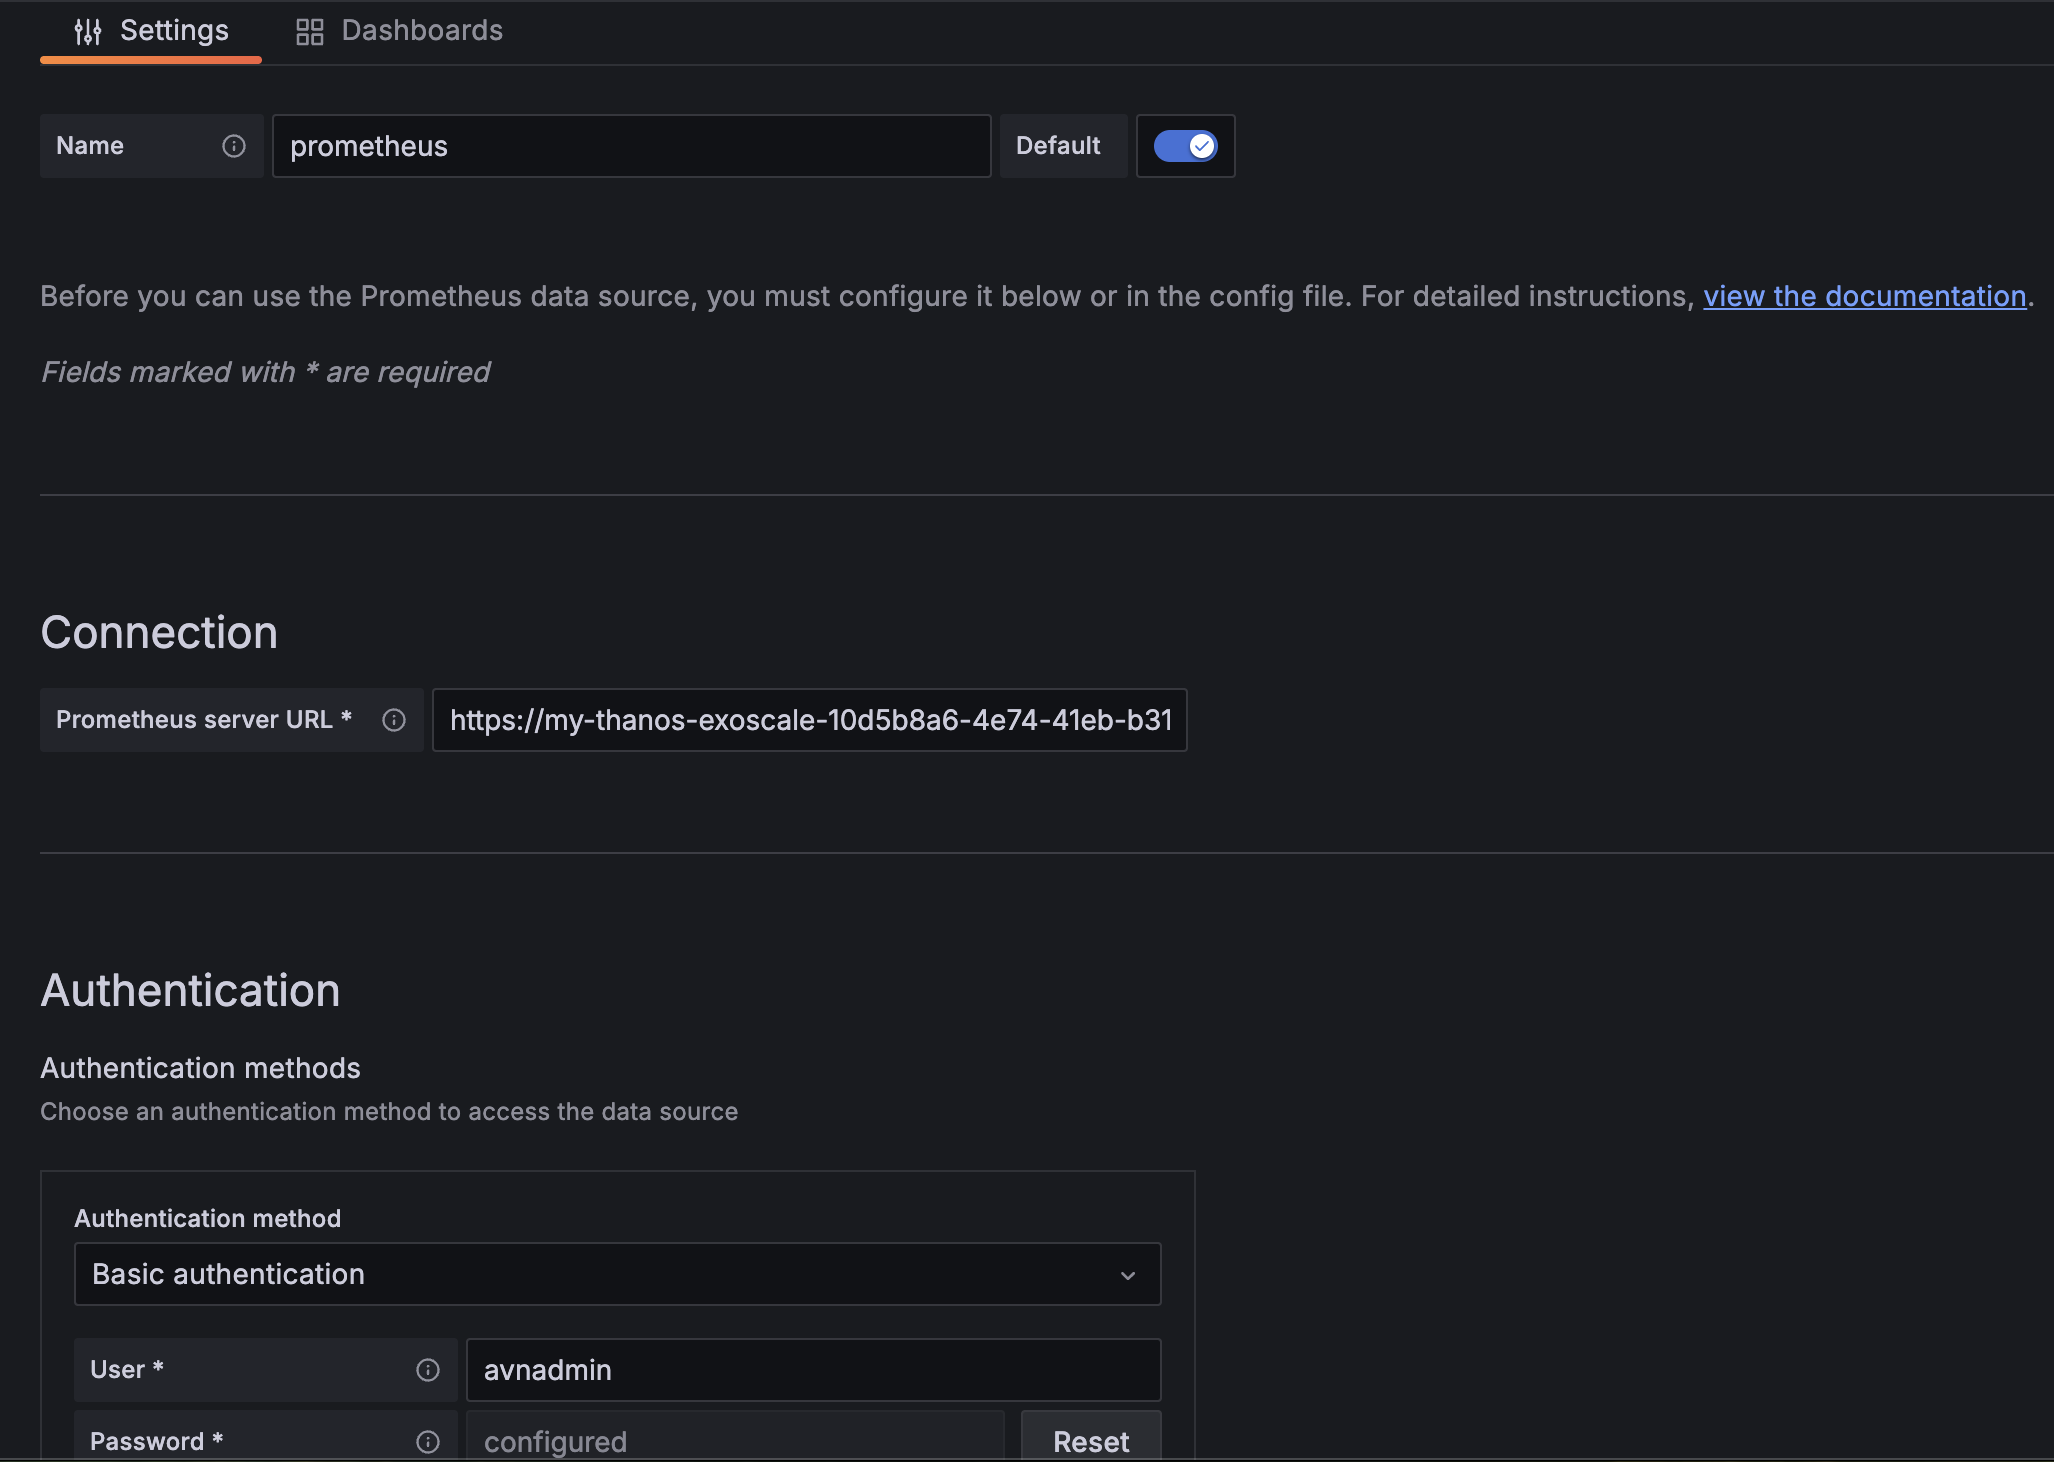
Click on Prometheus and configure it

Note
- Add your Data source name, here “Prometheus”
- Add your Prometheus server URL : https://yyyyyy-exoscale-xxxxxxxx-xxxx-xxxx-xxxx-xxxxxxxxxxxx.i.aivencloud.com:21700
- Add your Basic Authentication with User and Password
- Then click on Save and test
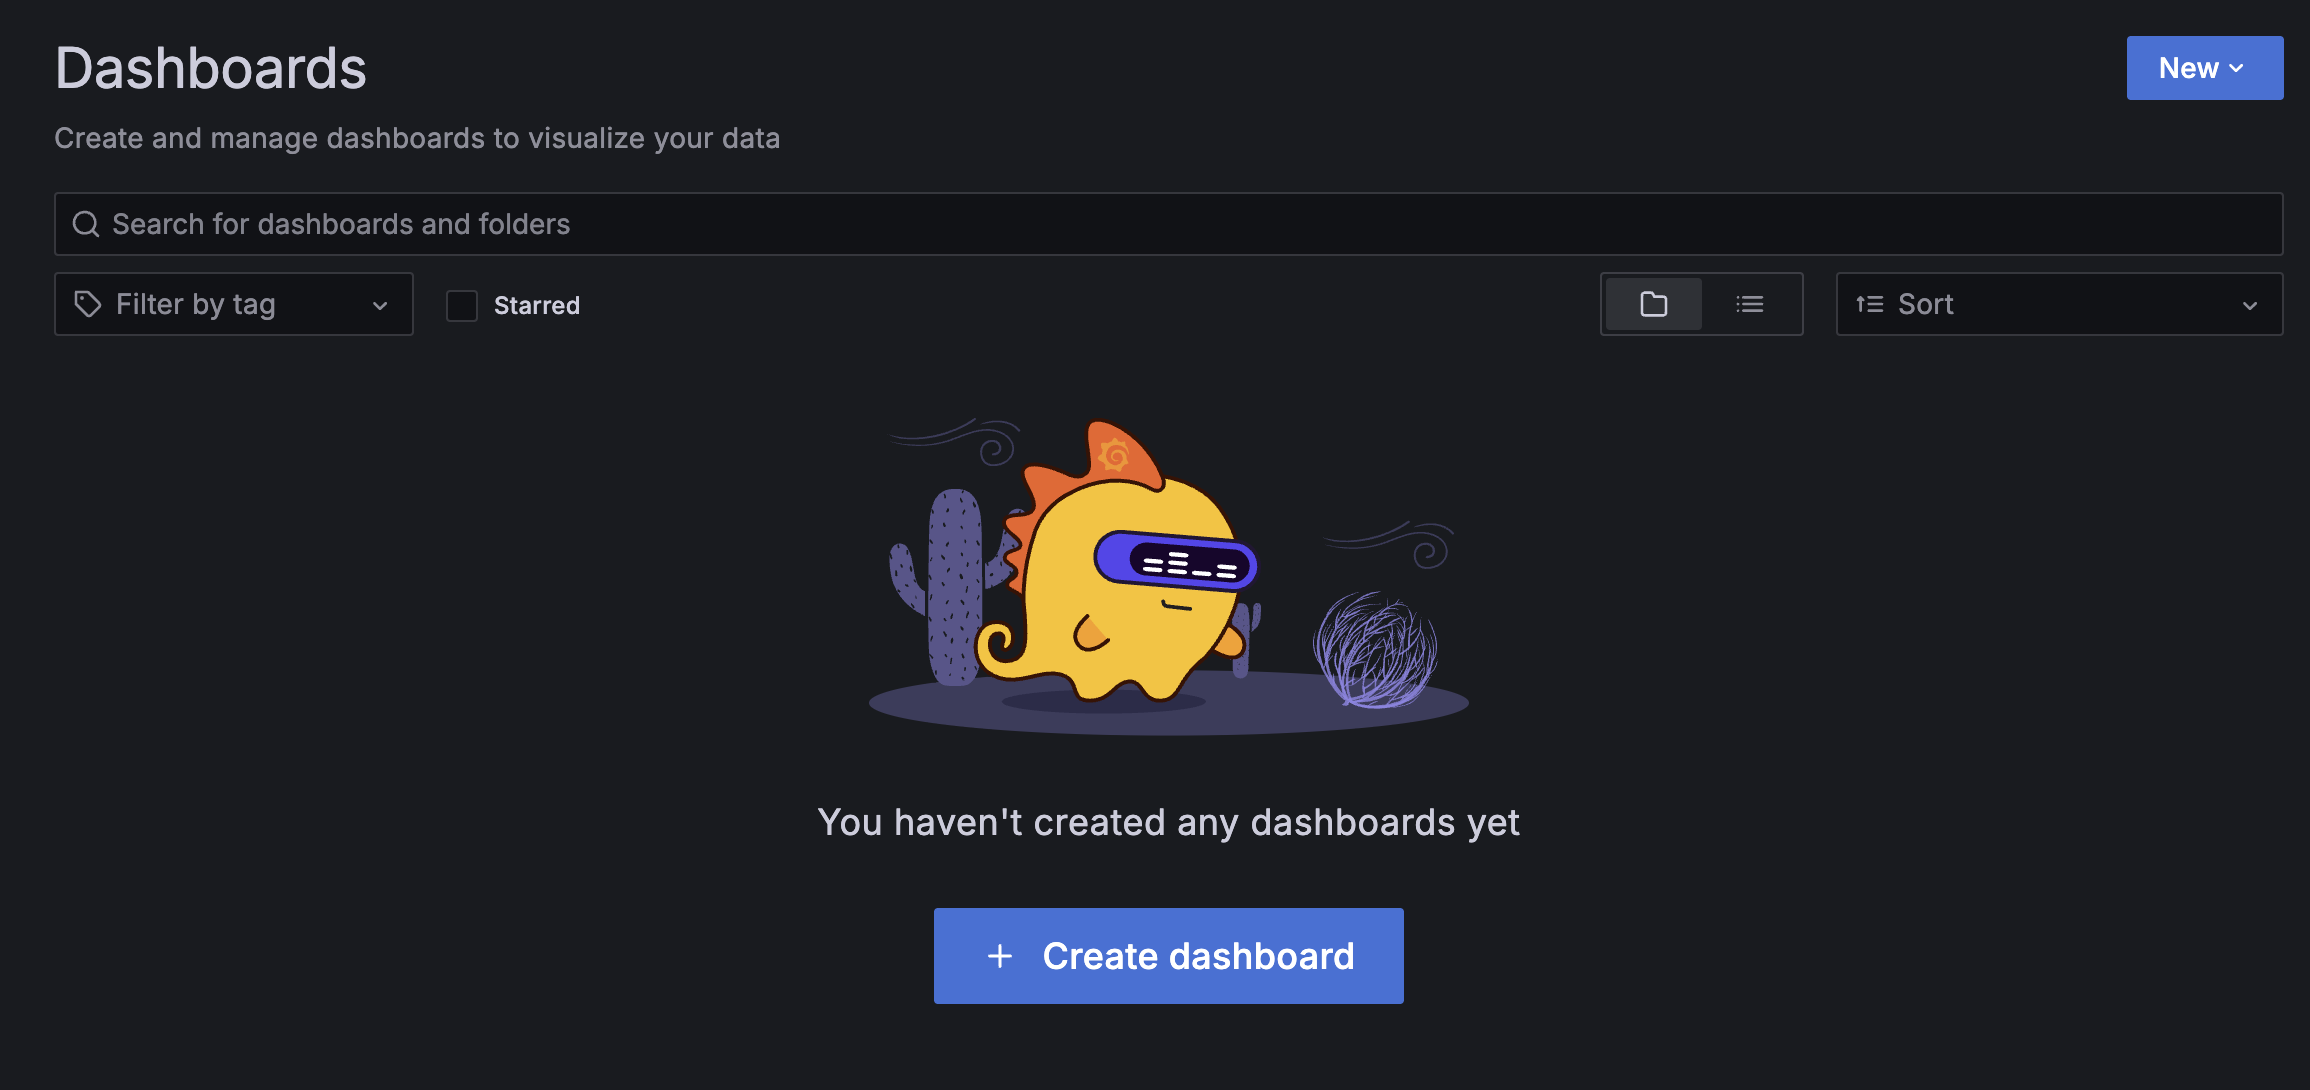
Create your dashboard
Just click on “Create dashboard” in Dashboards section and select your newly created Datasource. Then explore your metrics for your board.

Last updated on