# Integrate with Grafana
Connect Exoscale Managed Grafana (or external Grafana) to query metrics from Thanos.
## Create your Data Source
Connect to your Grafana Dashboard.
> **NOTE**
If you have an issue accessing it, verify on the Exoscale Console in your DBaaS Grafana Config that you have an IP filter set (like 0.0.0.0/0 if you want it open to all IPs).
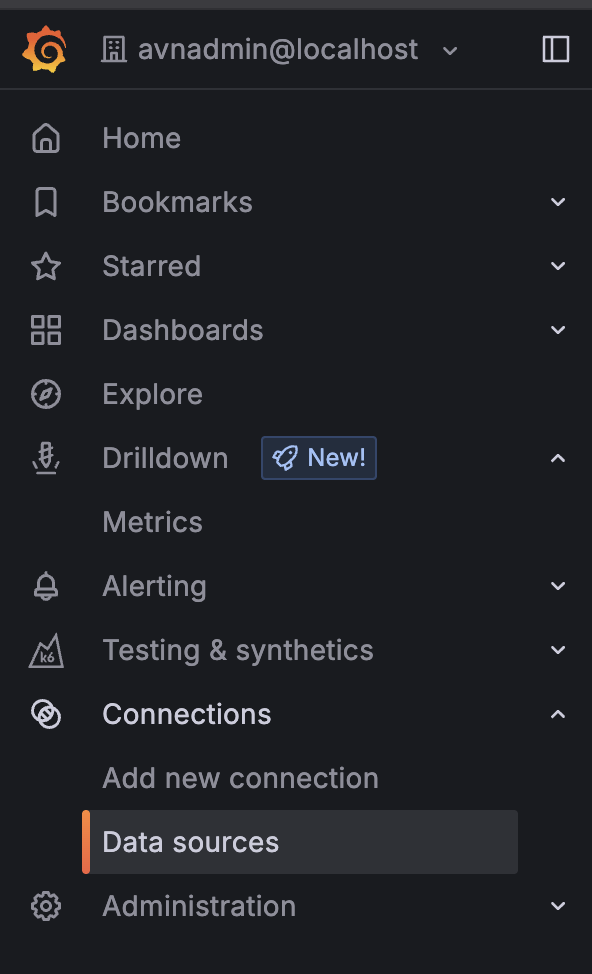
In the Menu, go to Connections > Data sources
 Add new data source (on the top right)
Choose Prometheus
Add new data source (on the top right)
Choose Prometheus
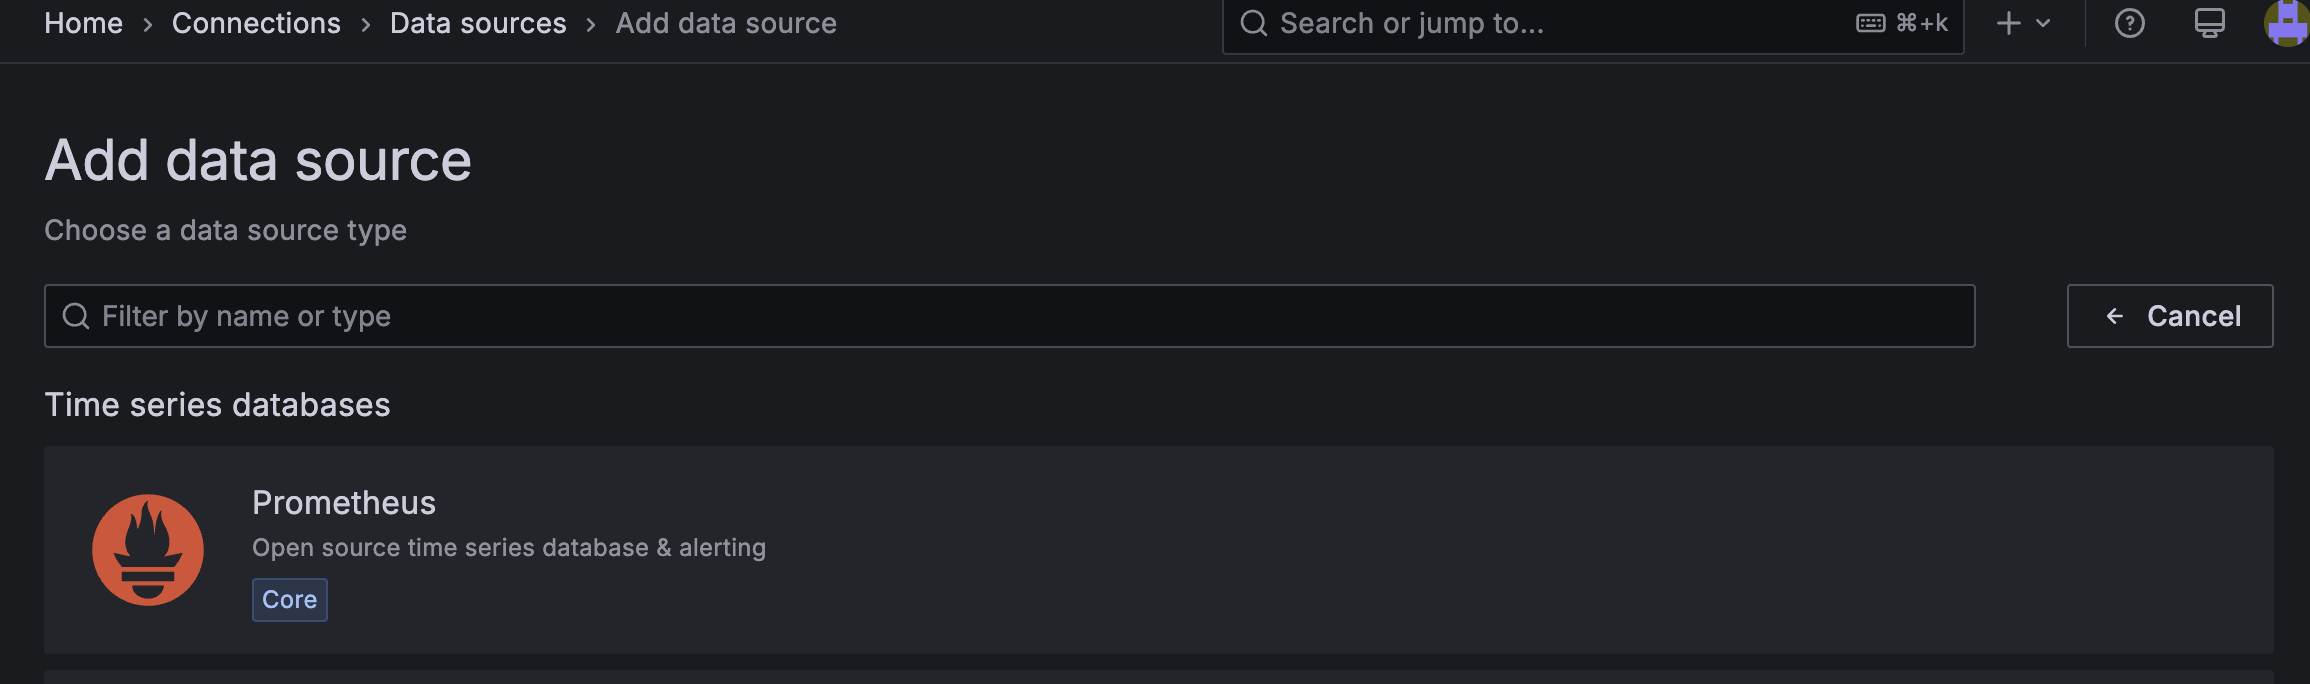 Click on Prometheus and configure it
> **NOTE**
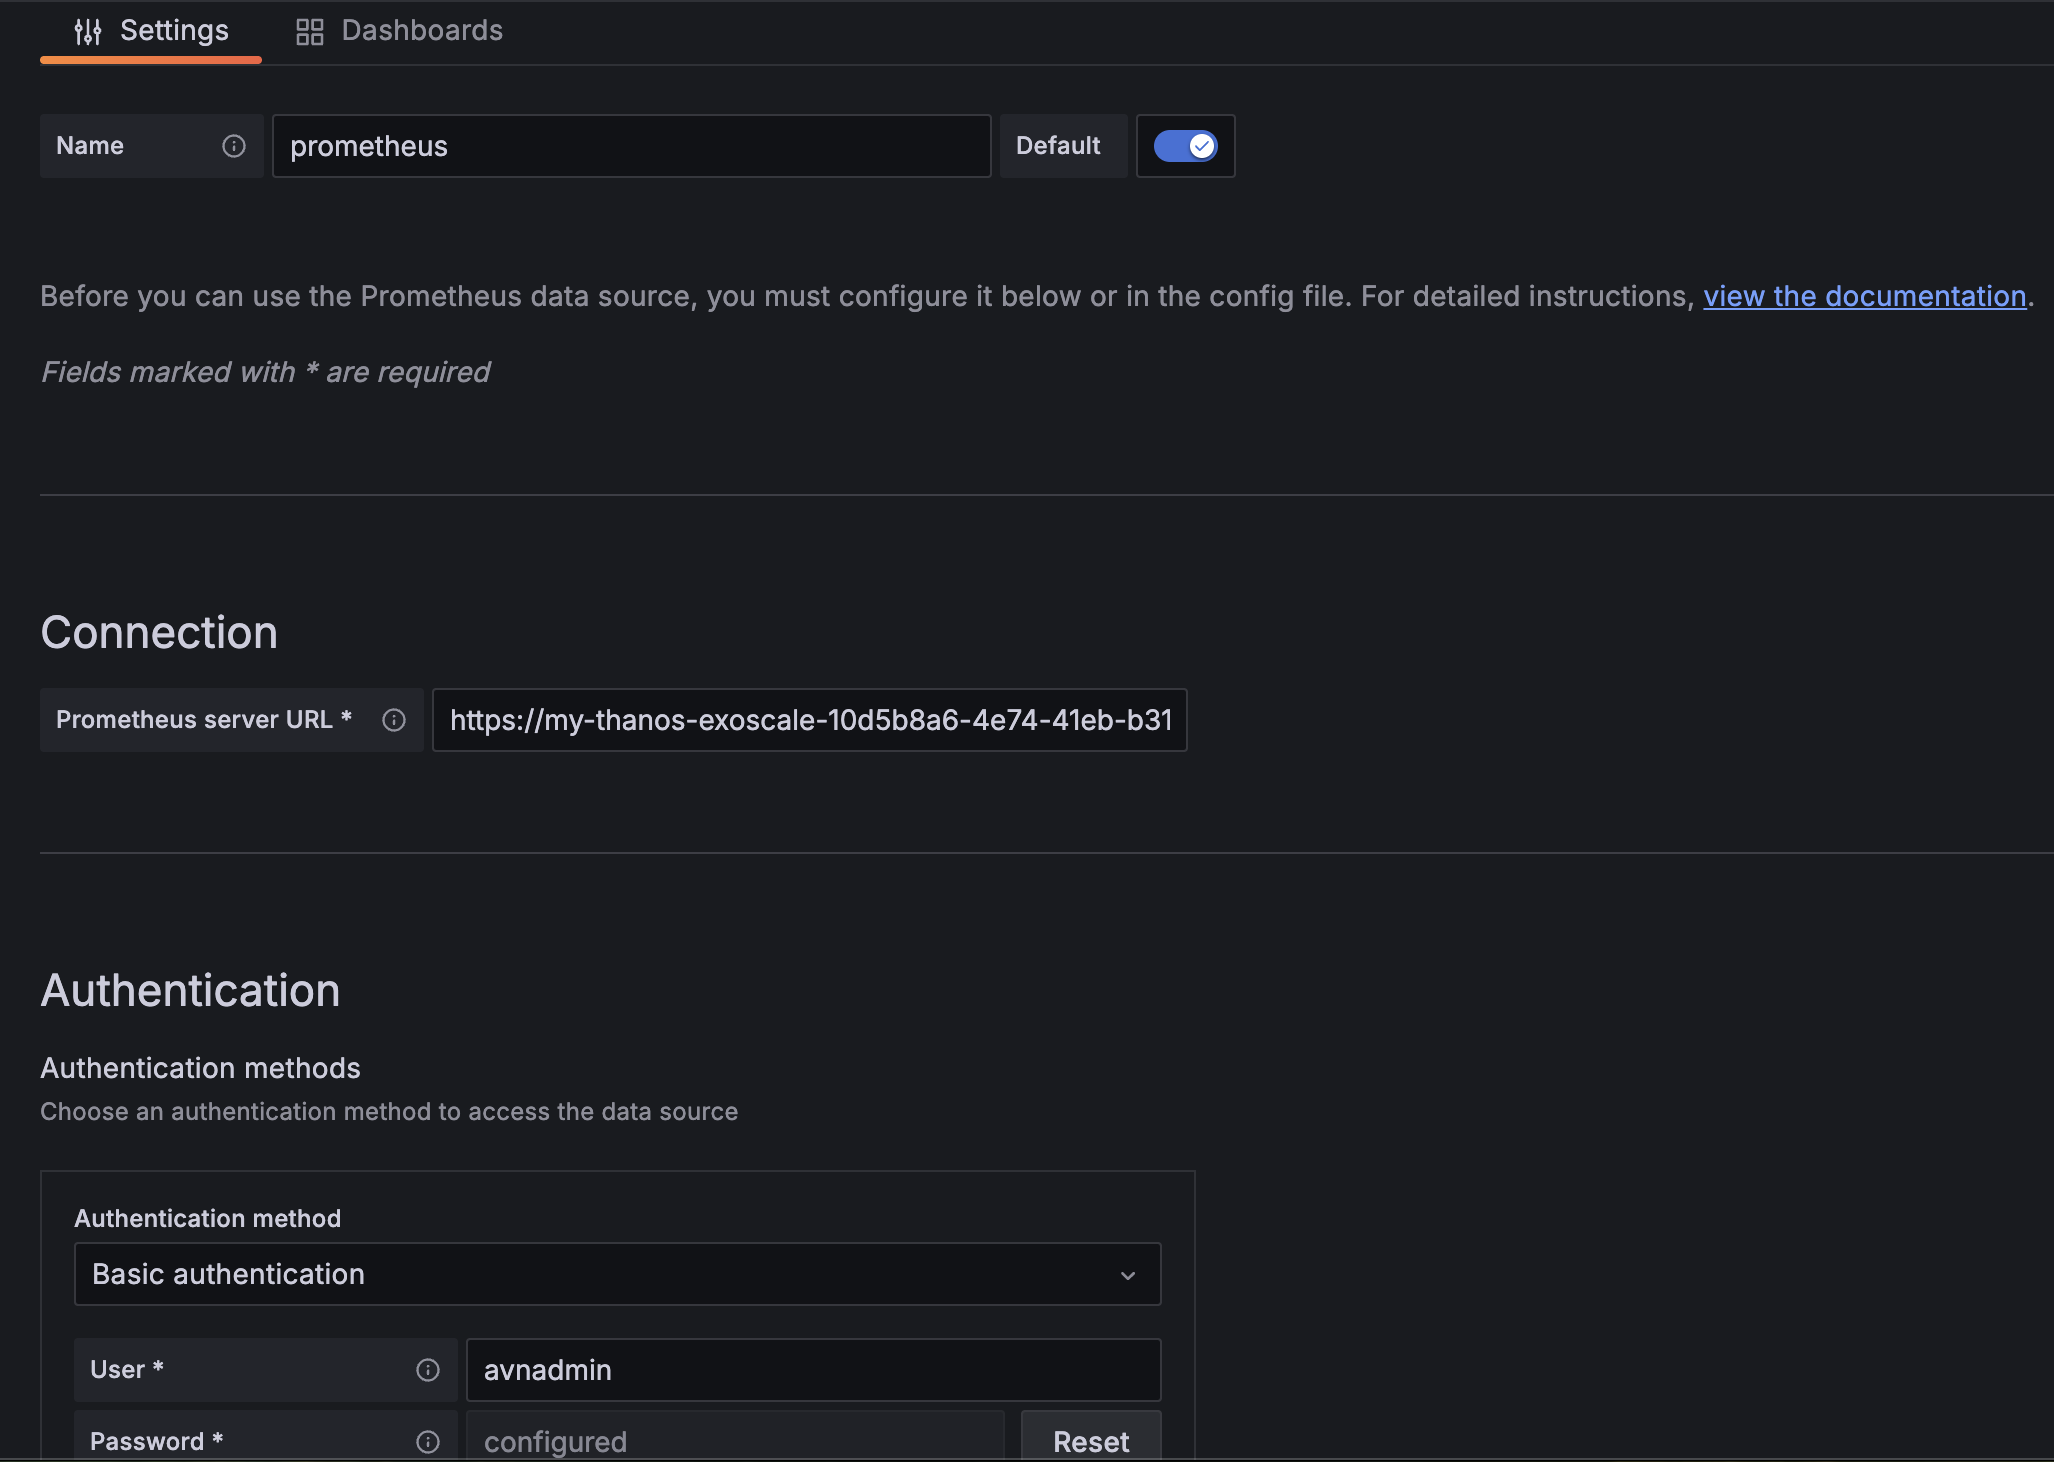
- Add your Data source name, here "Prometheus"
- Add your Prometheus server URL : https://yyyyyy-exoscale-xxxxxxxx-xxxx-xxxx-xxxx-xxxxxxxxxxxx.i.aivencloud.com:21700
- Add your Basic Authentication with User and Password
- Then click on Save and test
## Create your dashboard
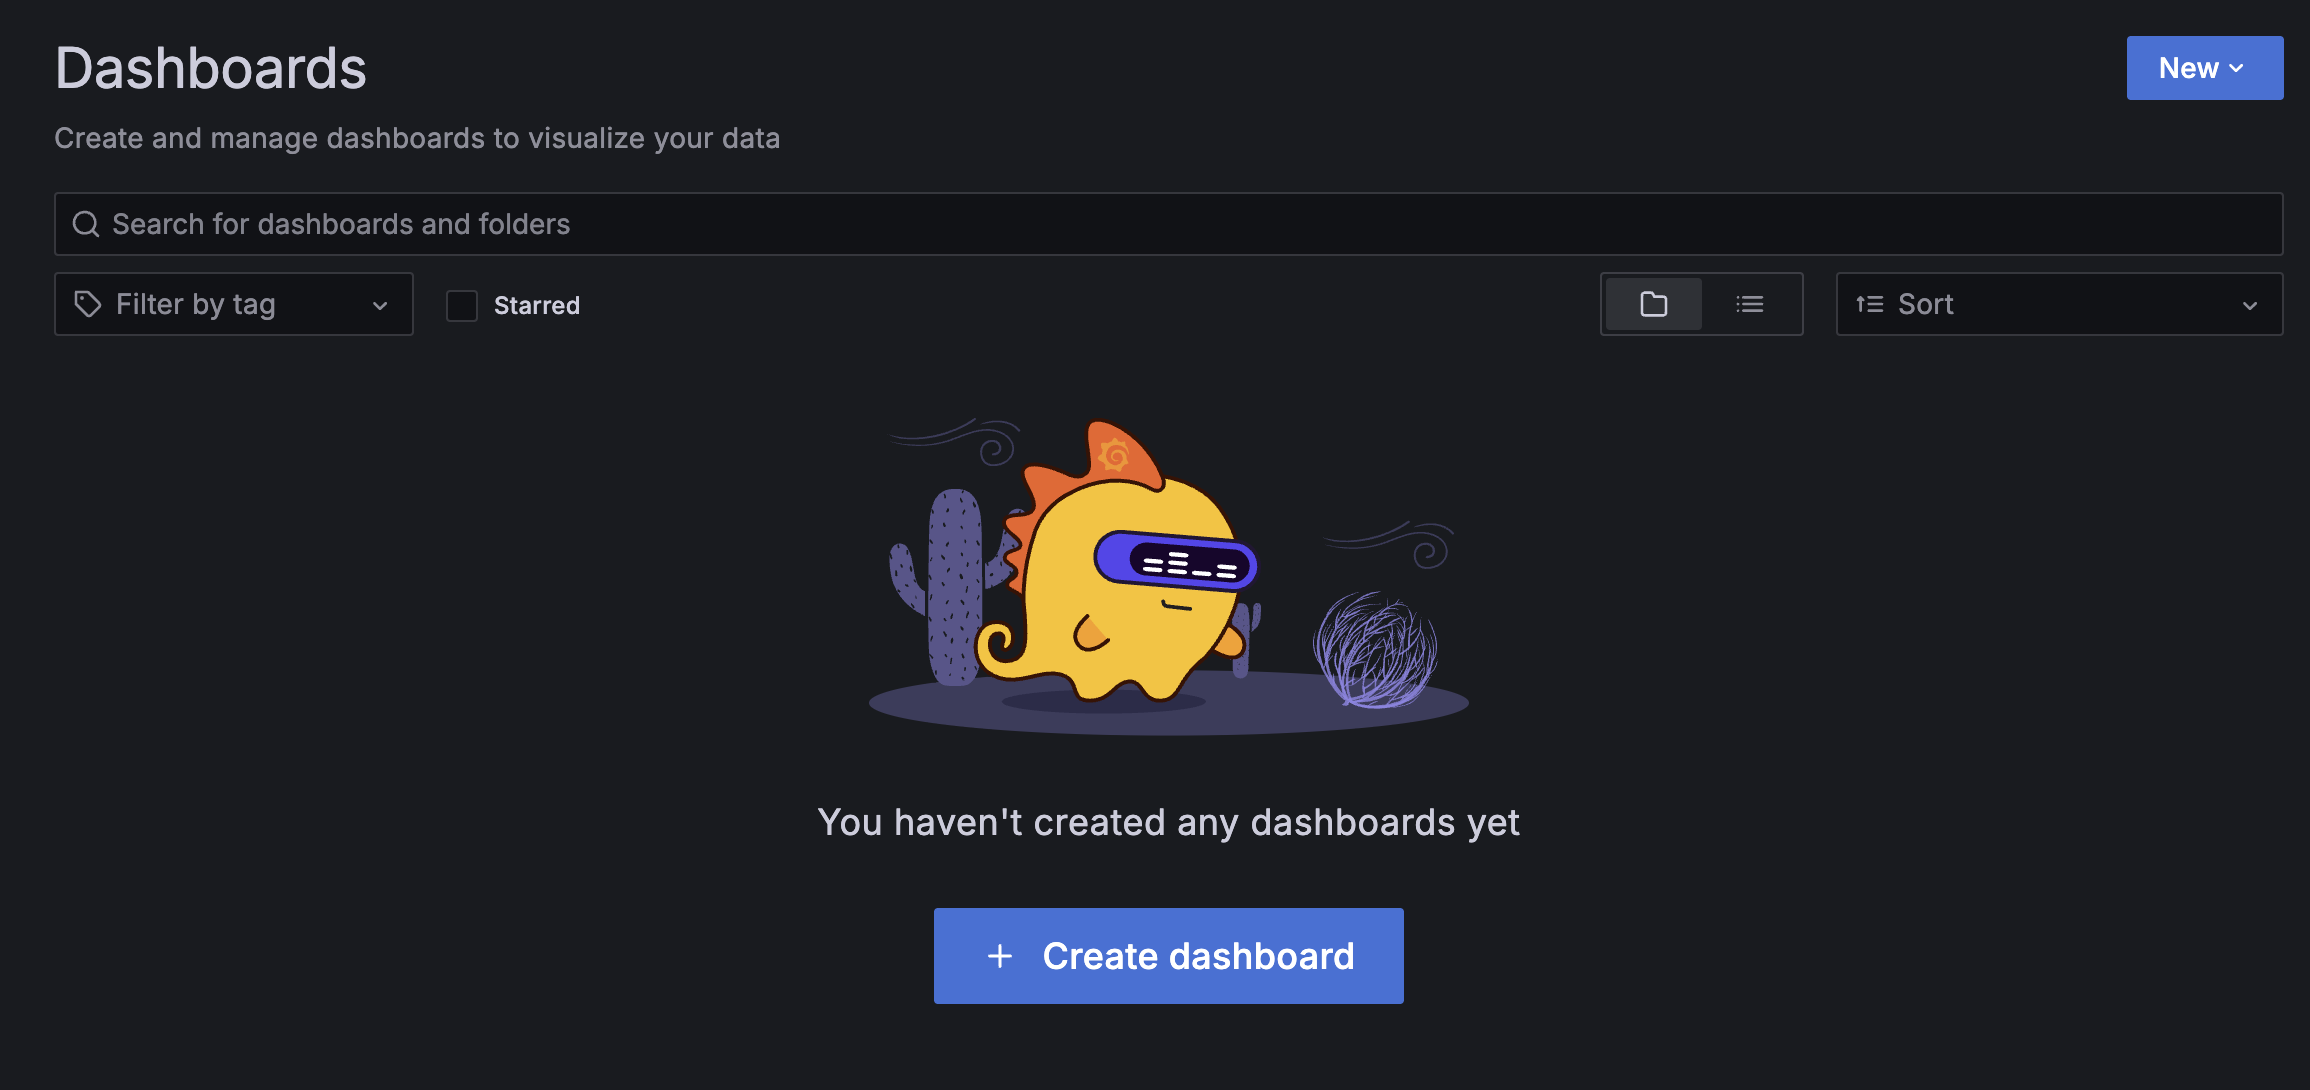
Just click on "Create dashboard" in Dashboards section
and select your newly created Datasource. Then explore your metrics for your board.
Click on Prometheus and configure it

> **NOTE**
- Add your Data source name, here "Prometheus"
- Add your Prometheus server URL : https://yyyyyy-exoscale-xxxxxxxx-xxxx-xxxx-xxxx-xxxxxxxxxxxx.i.aivencloud.com:21700
- Add your Basic Authentication with User and Password
- Then click on Save and test
## Create your dashboard
Just click on "Create dashboard" in Dashboards section
and select your newly created Datasource. Then explore your metrics for your board.
