How to use a Dashboard on Exoscale SKS
For Kubernetes, there are different user interfaces (or UI) available. You can use them to get an overview of your cluster, do basic monitoring, or create/scale individual Kubernetes resources.
This guide presents two possibilities for Kubernetes UI:
- The Kubernetes Dashboard, which runs as a web app on the cluster itself.
- The software Lens, which runs as a standalone application on the administrator’s computer.
If you are new to Kubernetes, we highly recommend to use some kind of UI, as it will help you find errors in your deployments more easily - Lens is especially straightforward in this regard.
Prerequisites
As a prerequisite for the following documentation, you need:
- An Exoscale SKS cluster
- Access to your cluster via kubectl
- Basic Linux knowledge
If you do not have access to a SKS cluster yet, you can follow the Quick Start Guide.
Kubernetes Dashboard

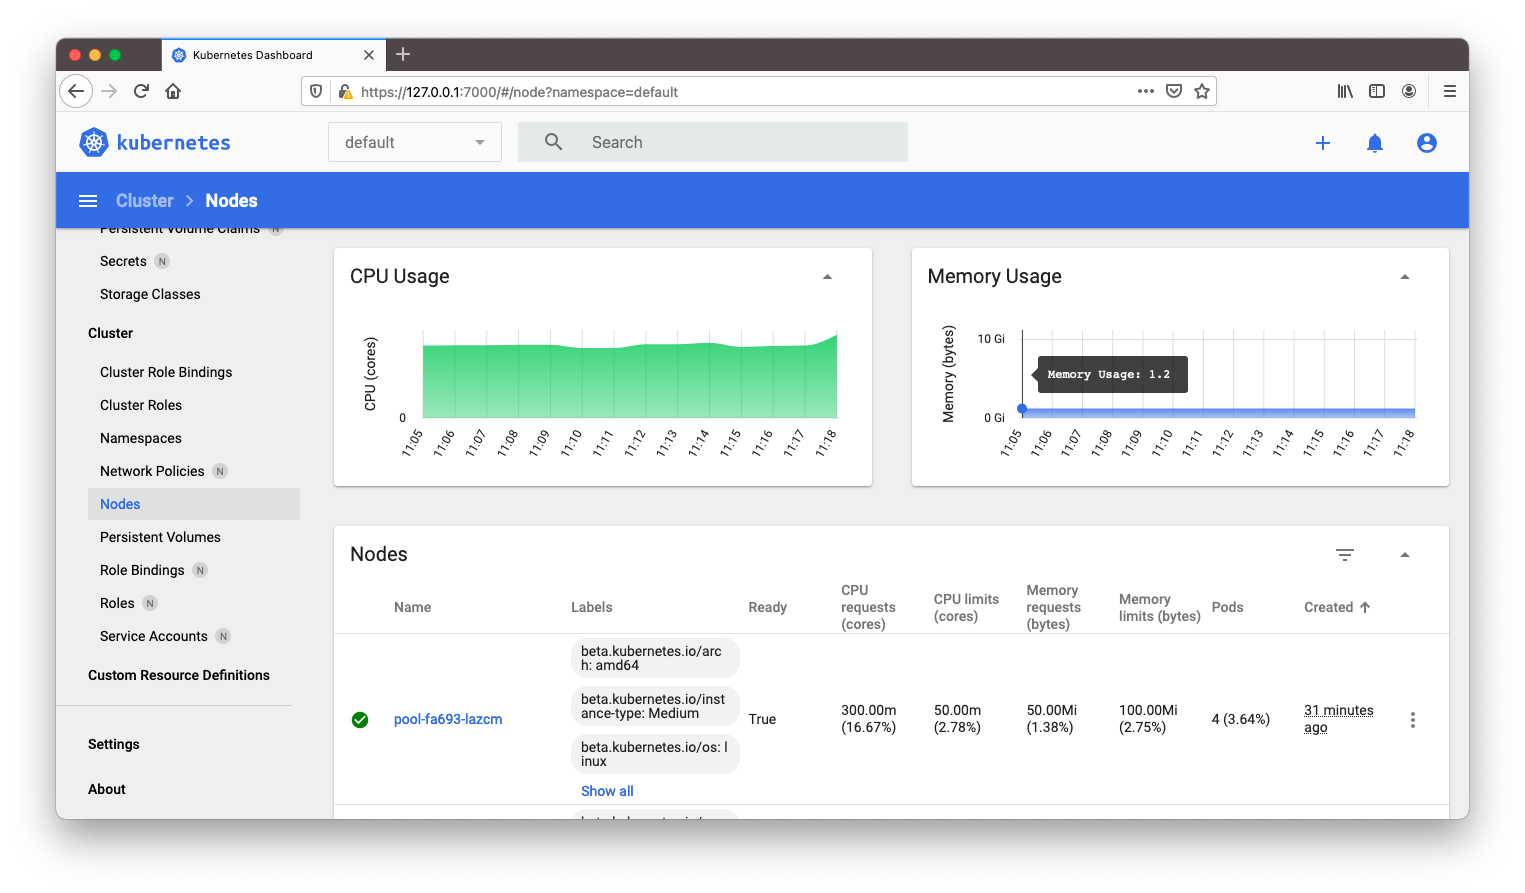
Kubernetes Dashboard runs in a cluster as a web application.
You can deploy version 2.2.0 with the following command:
kubectl apply -f https://raw.githubusercontent.com/kubernetes/dashboard/v2.2.0/aio/deploy/recommended.yaml
To get login credentials (a bearer token), follow the steps in the Kubernetes Dashboard documentation.
To access the dashboard UI on Exoscale SKS, use port-forwarding:
kubectl port-forward deployment/kubernetes-dashboard 7000:8443 -n kubernetes-dashboard
This will open local port 7000 and forward it to the container of the dashboard.
You then can access the dashboard at https://127.0.0.1:7000/, where you need to paste in the bearer token.
Note
For long-term usage, you might want to create an Ingress with Basic Authentification and a TLS Certificate. You then do not need to use kubectl for accessing the UI.
Lens
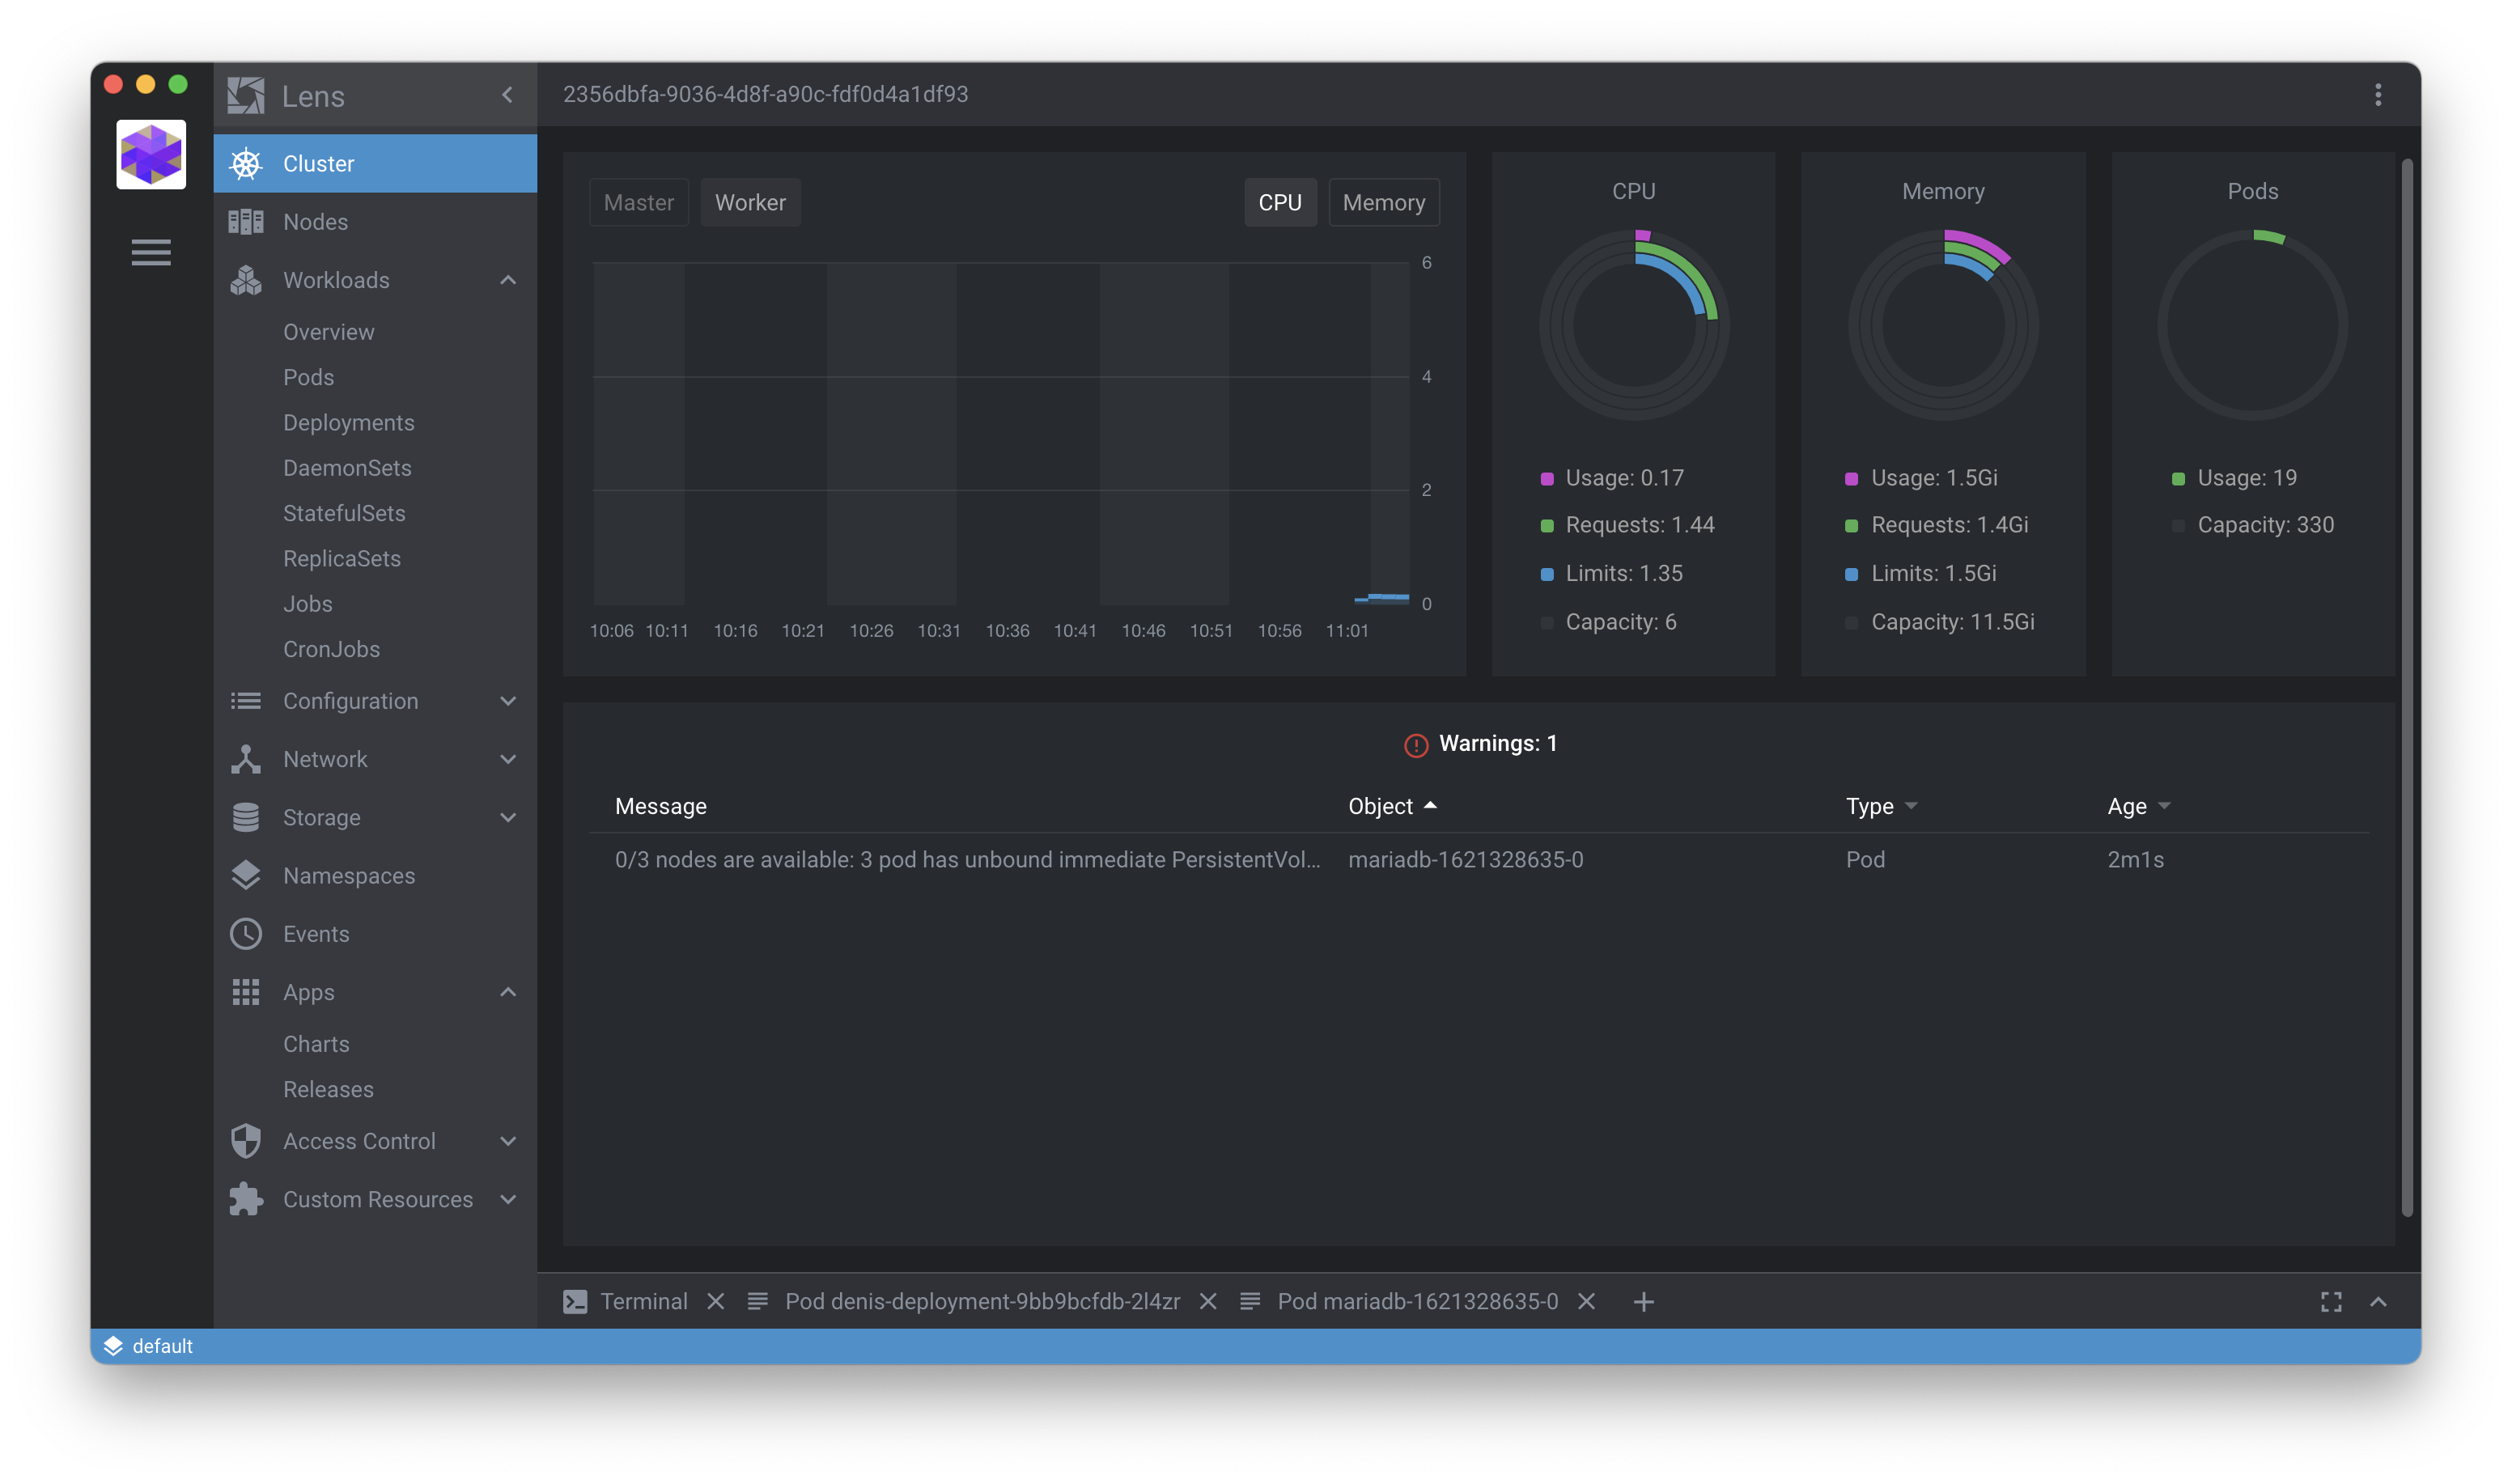
Lens is easy to install and use, as it runs as a standalone application on your computer and does not require any installation in the cluster itself. It uses your kubeconfig to authenticate against the cluster.

Download Lens from its website at k8slens.dev.
After you install Lens and start it, click the plus icon (+) and select your kubeconfig to add a cluster.
If you want to enable extended metrics (like CPU usage), you need to install the Metrics stack. Right-click on your cluster in Lens, then go to Settings. At the Features/Metrics Stack, click on Install.
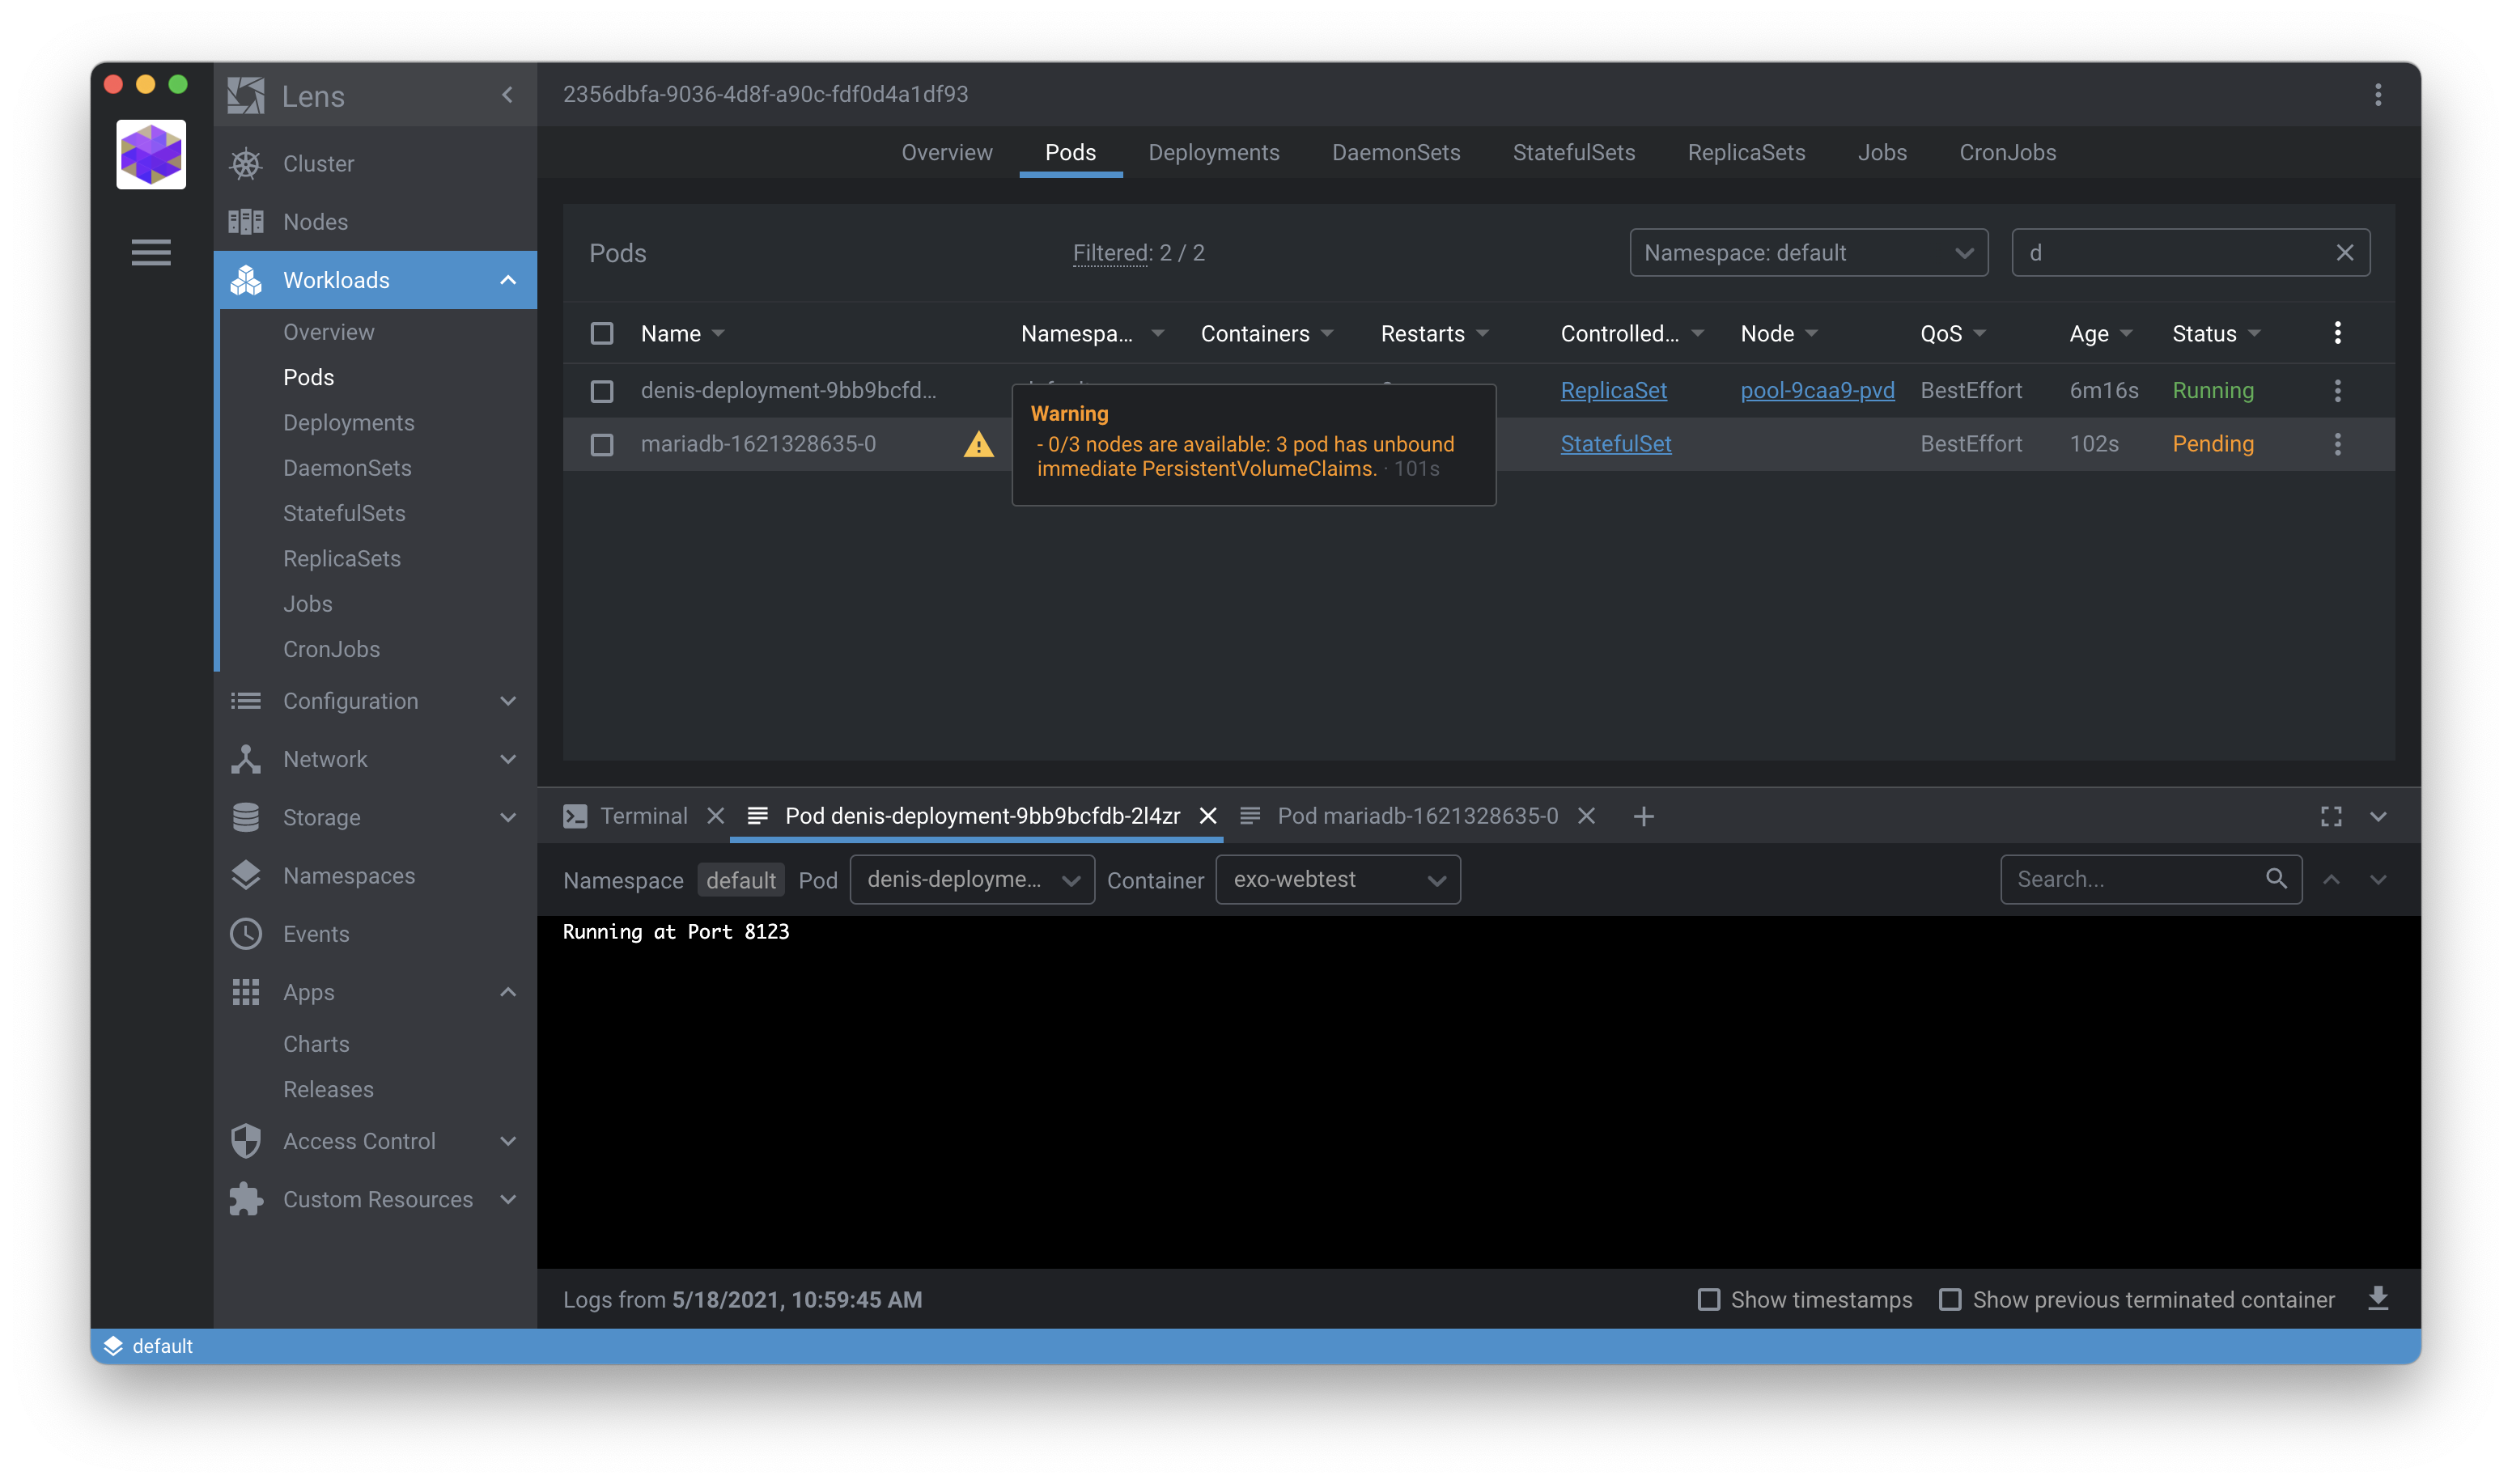
When you deploy applications (pods, deployments et cetera), you can see potential errors directly in the cluster overview. Lens will also show them in the Events tab, and as a warning besides Pods and Deployments. Additionally, you can directly get a shell of containers, or view their logs.

Additional Resources
See more about the Kubernetes Dashboard.
Learn more about Lens.
